How it works

Get daily buy and sell signals

On stocks, forex, commodities.

Create your portfolio of stocks, currencies and commodities and ask today signals to alert you whenever there is a buy or sel sgnal on any of them.

Daily buy and sell signals

Fast

Looking for short term entry point – Fast is the one to be used. It’s expected return time frame is 5 to 10 days, or price periods (so if the prices are based on weekly/monthly closes fast would be for a holding period of 5-10 weeks/months).

For day traders - you will be out before the oposite signal is generated.

Slow

Slow signal appears only 2x-3x every 250 time frames approximately (on a monthly basis it is rather a rare event). It often allows to buy the stock at quite depressed prices. Even though it is technical in nature – value investors (fundamentalists) have already bought the stock – or started buying.

Asymetric

Asymmetric uses reversals with momentum – basically if there is a momentum in stock prices then go Fast in the direction of the momentum and go Slow in the opposite direction. For example if the stock is above 200D moving average and we have Fast buy – then go and buy, sell only if the signal is the Slow sell. This way – we can jump in the momentum wagon even if we prefer Slow signal generator.

Backtesting the strategy

Signal and strategy

Before describing the strategy backtesting, let’s describe the difference between the strategy and the signal. In our system the signal can take two states, a buy and a sell. Strategy is using signals and is managing the cash assigned to it in a given period. One of the well known strategy is Buy and hold, that is the strategy that buys at the beginning of the period and sells at the end of the period (so why is it called buy and hold?). One of the employed strategies in the mobile version is Long only. The entire cash balance assigned to the strategy is used to purchase shares of stock (or currency, or commodity or forex) at the prevailing market price at the first occurrence of the buy signal. Once bought, the cash balance turns to 0 and stock balance is filled. All subsequent buy signals are ignored until first sell signal occurs, at that time all shares are sold – and cash is credited with the result. As time goes by, the strategy is waiting for the next buy signal and is using available cash (increased with profits or decreased with losses) to purchase shares.

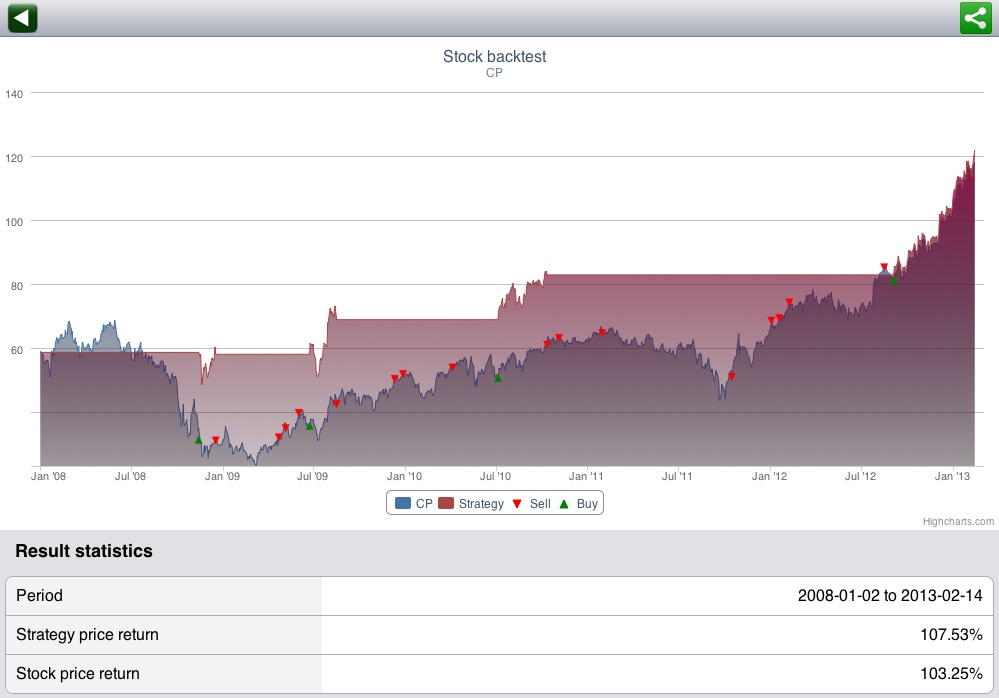
Bellow an example of Long only strategy using Asymmetric signal on CP. In the mobile app – a given strategy is compared to buy and hold. Bellow the equity chart – there are statistics of the strategy/signal track describing the performance of the strategy. We can notice that after the position is sold all subsequent sell signals are ignored – as indicated in unleveraged Long only strategy. Flat line indicates that the strategy has no market exposure – and has achieved the same return in the period as the buy and hold while having spent less then 12 months exposed to market compared to buy and hold which is a bit more than 5 years.

Backtesting a single stock

While backtesting the strategy the following conditions are used:

  • there is no slippage – meaning the purchase and sale is done on a closing price basis (upon the signal) and liquidity of the of the stock is infinite – strategy trades do not generate any price impacts
  • no transaction costs are assumed
  • stock borrow for short sale assumed available
  • if equity becomes negative free lending is assumed
  • leverage can be used only in the desktop version and is expressed as a percentage of the available balance – bellow an example of ABBN.VX stock – Long Short Asymmetric 1x long and 1x short and following with the leverage increased 2x (both long and short). As we can see the leverage can significantly change the behavior of the strategy while using the same signals. Exposure to the stock is employed in units. Say we encountered a buy signal, the strategy will purchase the stock with 1 unit of cash and will keep another 1 unit available (assuming 2x leverage) in the case we cross another buy – strategy purchases another unit of stock (we have 2x and our leverage level is now exhausted). If we cross a sell now 1 unit is sold and 2nd unit is kept.
  • short margin account is not remunerated

Backtesting a portfolio of stocks

Backtesting a portfolio of stocks is as simple as running single stock backtest equally weighted as many times as there are stocks. Bellow Dow component backtest snapshot in the period Jan 2008 till Jan 2013 compared to DIA (a Dow ETF) buy and hold.